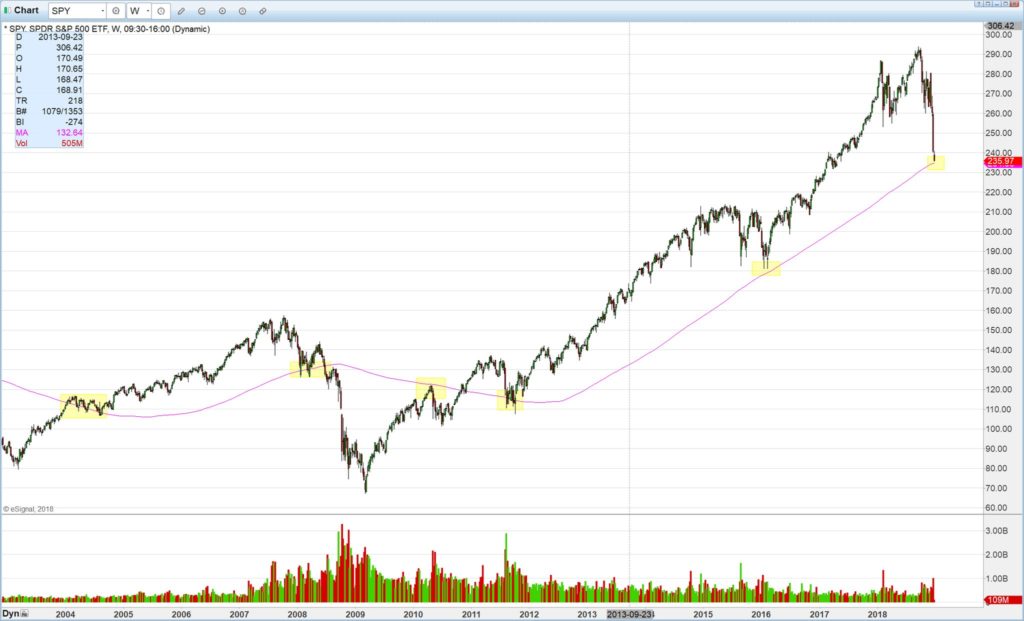
Below is the weekly 200sma, the last stand of any major SMA support. As you can see it’s been key now for the last 14 yrs. In the last bear market (financial crisis) we stayed below for 2 years 2008-2010. Last time we tested the actual line was in 2011 when price stayed on it for weeks before finally climbing back over until hitting it again today, seven years later. Do note that as much as we would like a magical bounce on it this week from past observations when price has used it as support (2004, beginning of 2005, 2011) it’s been somewhat messy affair that lasted weeks with a few weeks dipping just under.

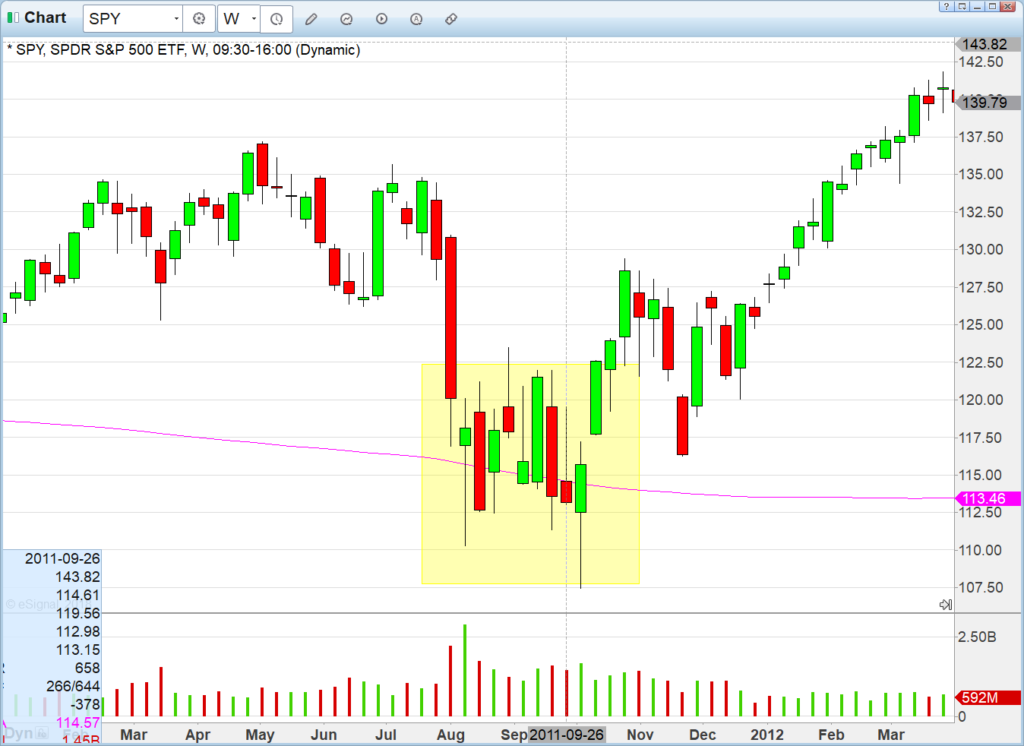
Here is a close up of the last time the 200sma weekly hit in 2011 where we spent 9 weeks basing on it. Two things to note: 1) there were three weeks it closed under, 2) but there were no continuation candles down. Price refused to budge down for continuation follow through below the 200sma and finally bulls won and took it higher.

The best case scenario is that what happened in 2011 also happens in 2018-2019 where we bounce/hold on this level and climb back up. Worst case scenario of course is another recession and prolonged bear market that lasts for example 2019-2021. We expect at least some attempt at holding this zone, give or take 3-4% similar to 2011, especially since we are so stretched to the downside when we hit it today after 8 sessions under the 9/20EMA on 60min time-frame. Whether that holds or not though after any initial bounce is another story. One step at a time. For now enjoy the day off tomorrow and focus on the holidays, friends and family. We’ll see you Wednesday on the streams. HCPG
2 thoughts on “The last stand”
Comments are closed.