All posts by hcpg

The sector that keeps on giving

#IBDPartner

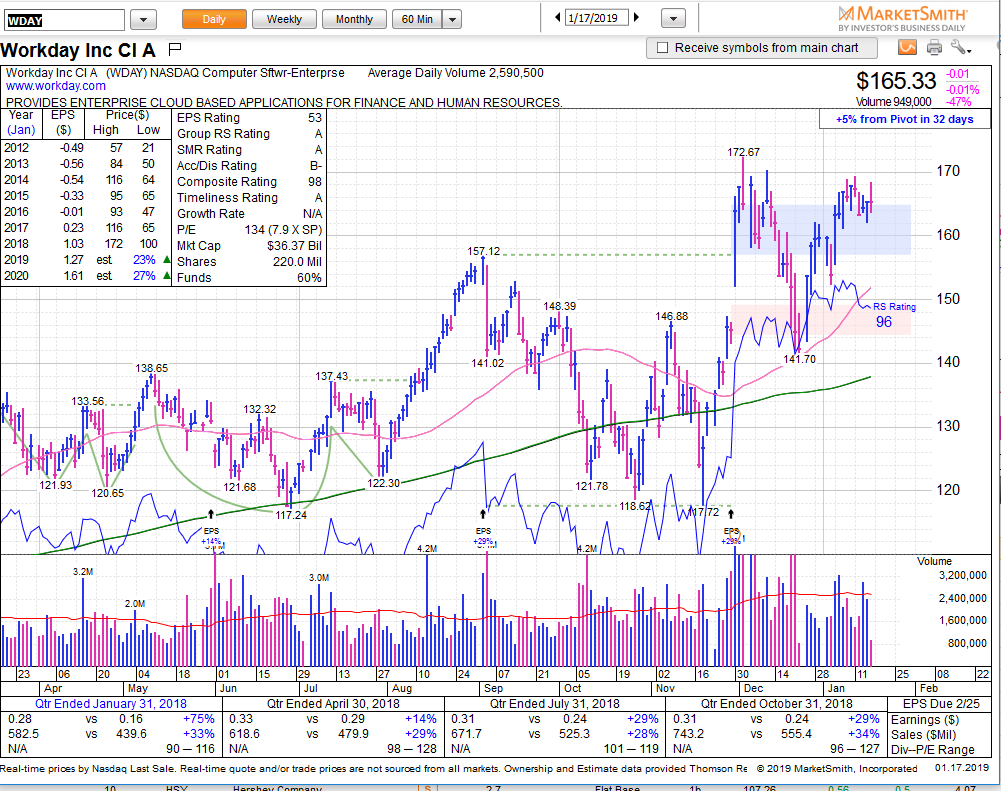
We’ve been talking about the software sector now for a couple of months and blogged about it in December. Back then we wrote about how our MarketSmith scans found WDAY (165), TWLO (94), PAYC (133), NOW (186), CRM (147), ZEN (60), NTNX (44), and COUP (66) it was before the glitch (Dec 03) and yet every single name is significantly higher (the lowest still up 6% and the highest 39%) than it was on December 03 while the QQQ is 3% lower! Pretty amazing divergence. To sum it up: this sector remains hot and is currently the clear leader of momentum stocks.

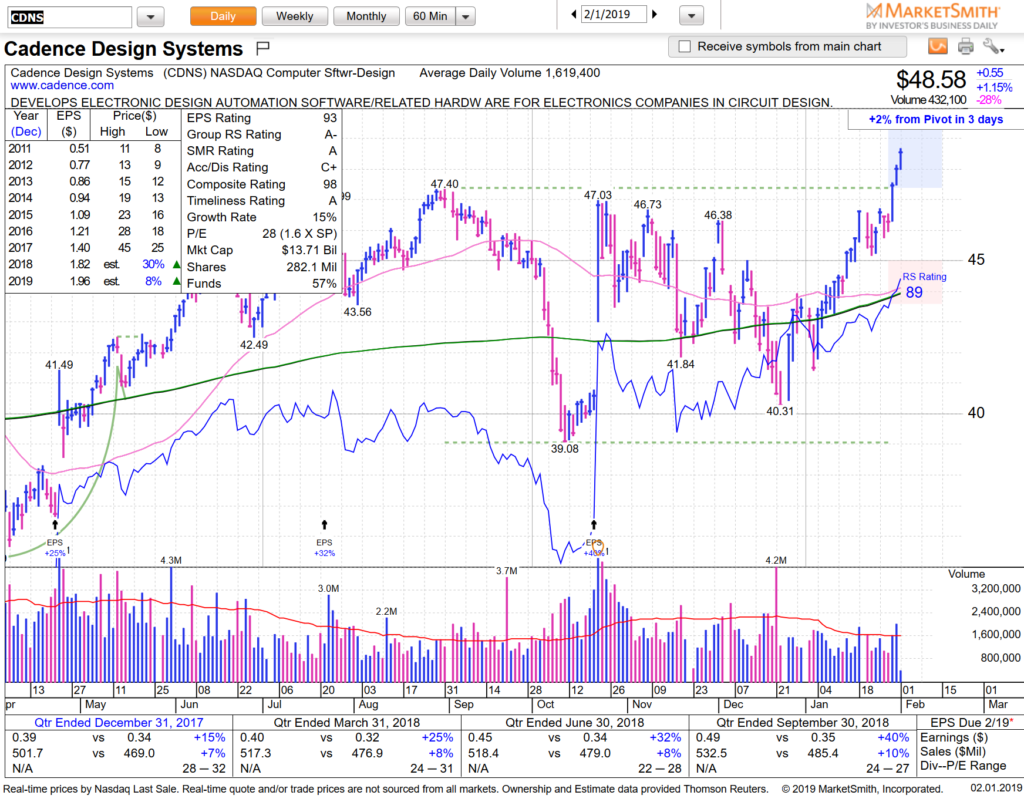
And the set-ups continue — we posted CDNS last week on our stream and it’s already up 5% and looks great for continuation.

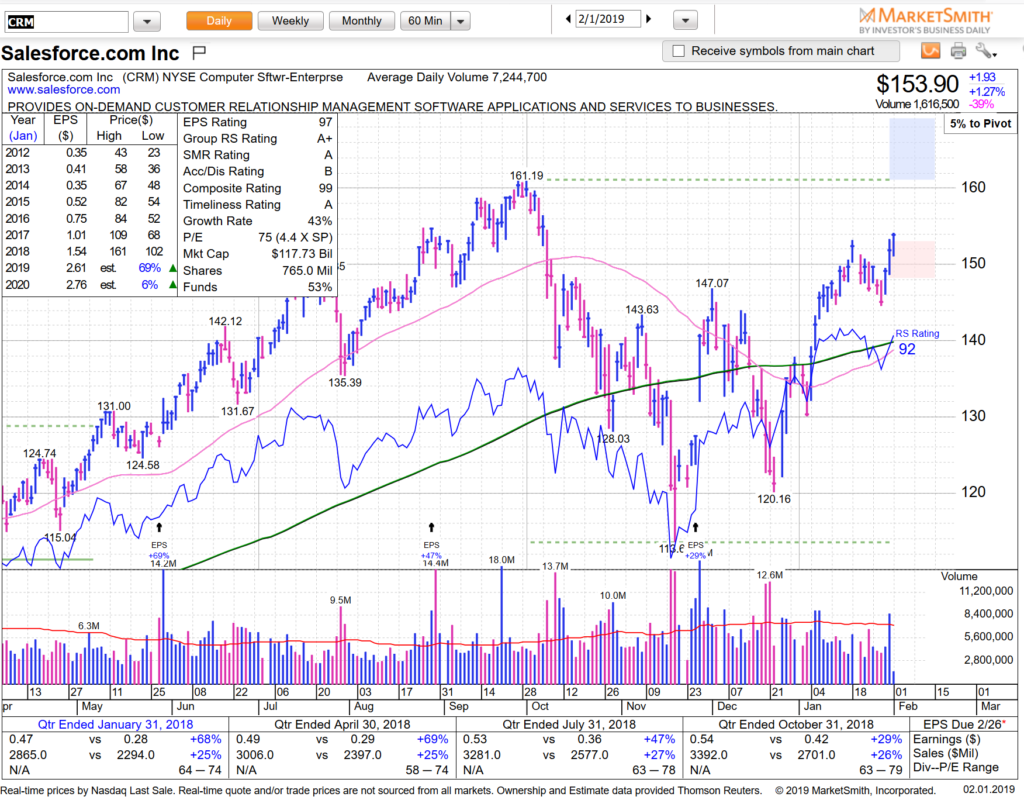
CRM leaving base and we are swing long — great chart.

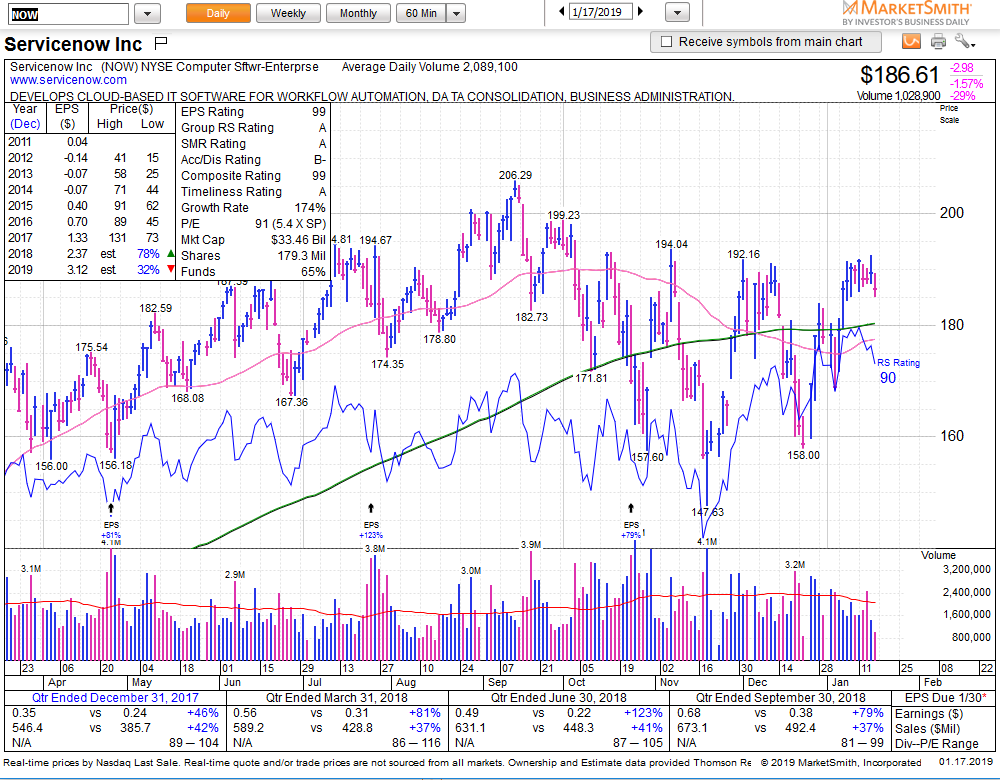
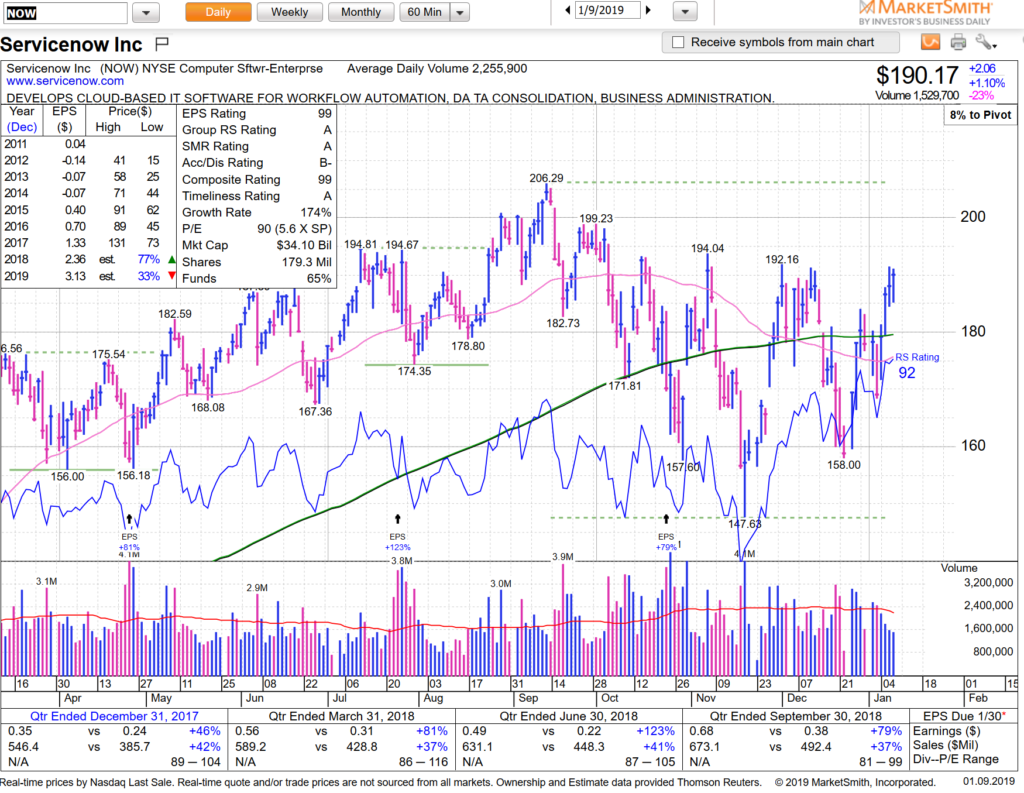
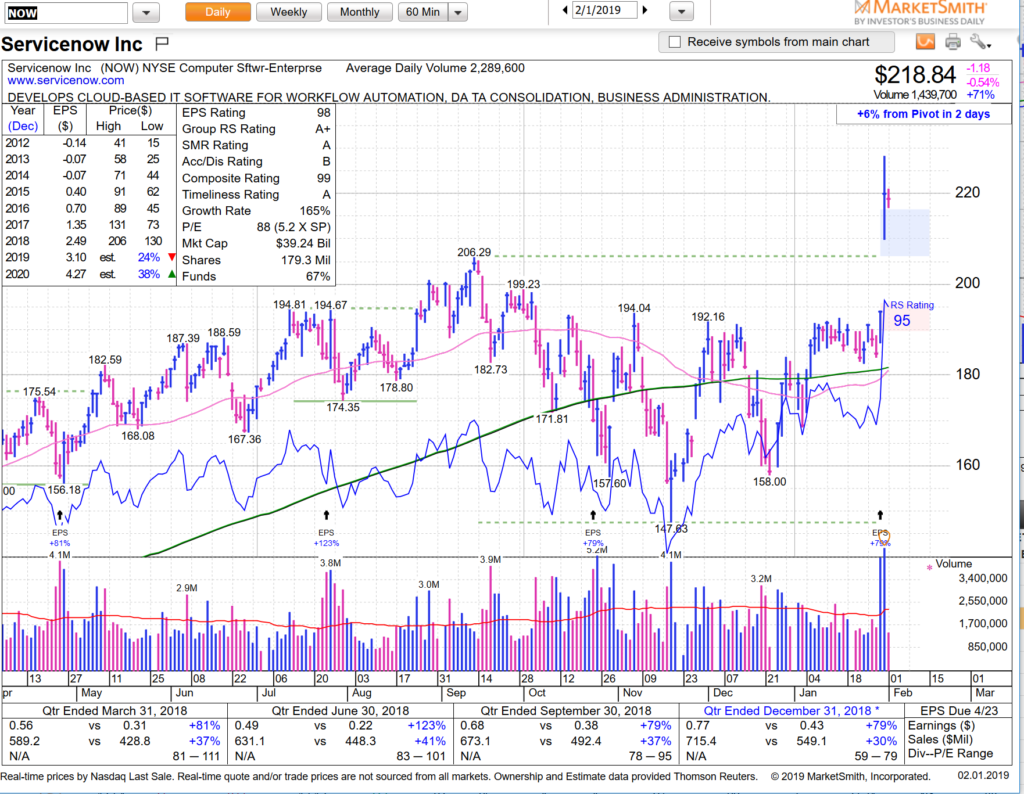
NOW big gap on earnings — we missed this one but are stalking for another set-up after a few days base.

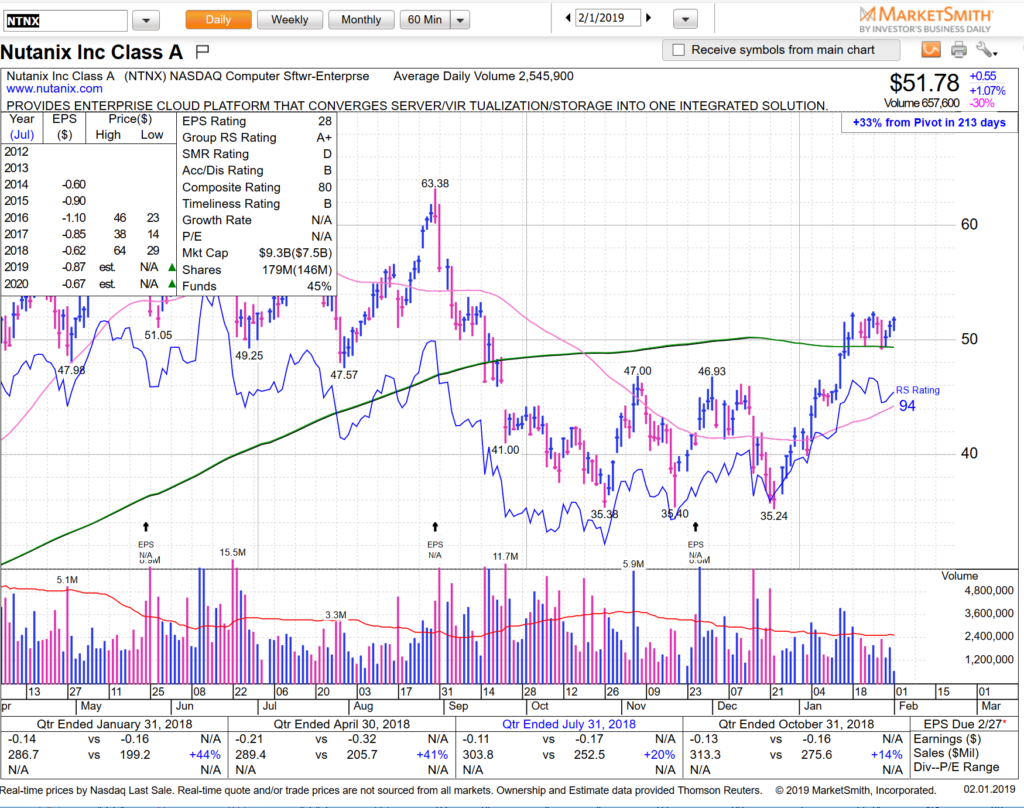
NTNX we talked about last week in our streams — love the way it’s holding above the 200sma. The only thing that makes us slightly cautious is how long it is taking to lift away while sector has already moved. Do they know something we don’t know?

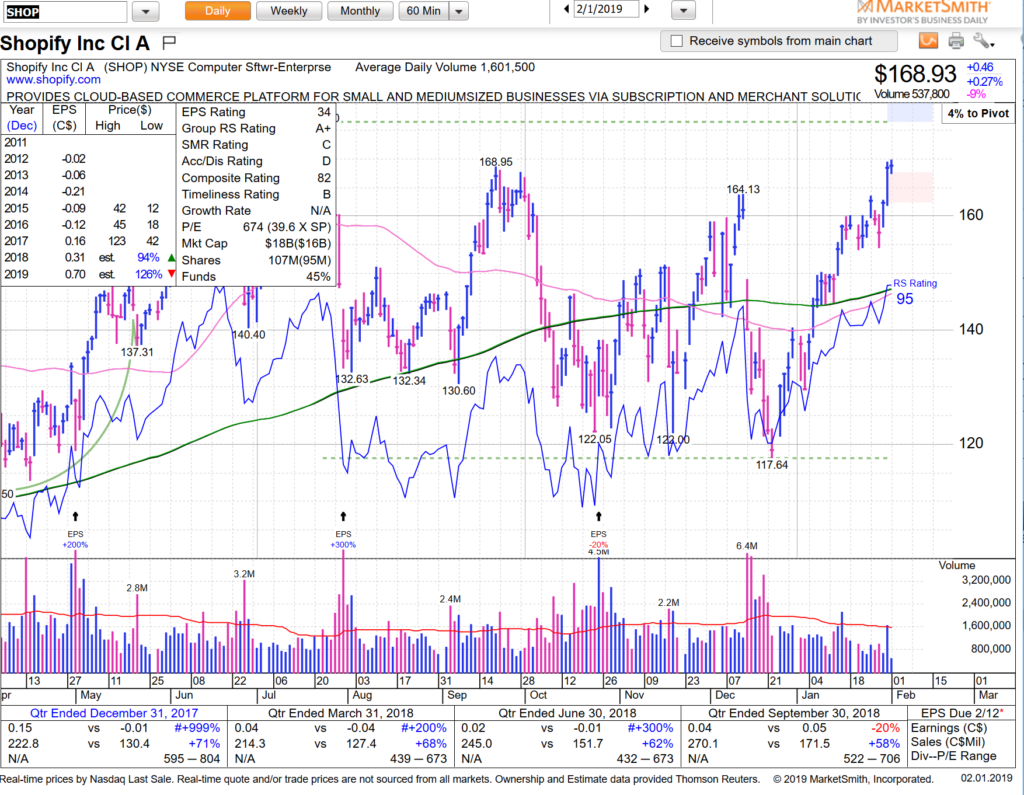
SHOP 160 breakout from our newsletter continuation — great chart.

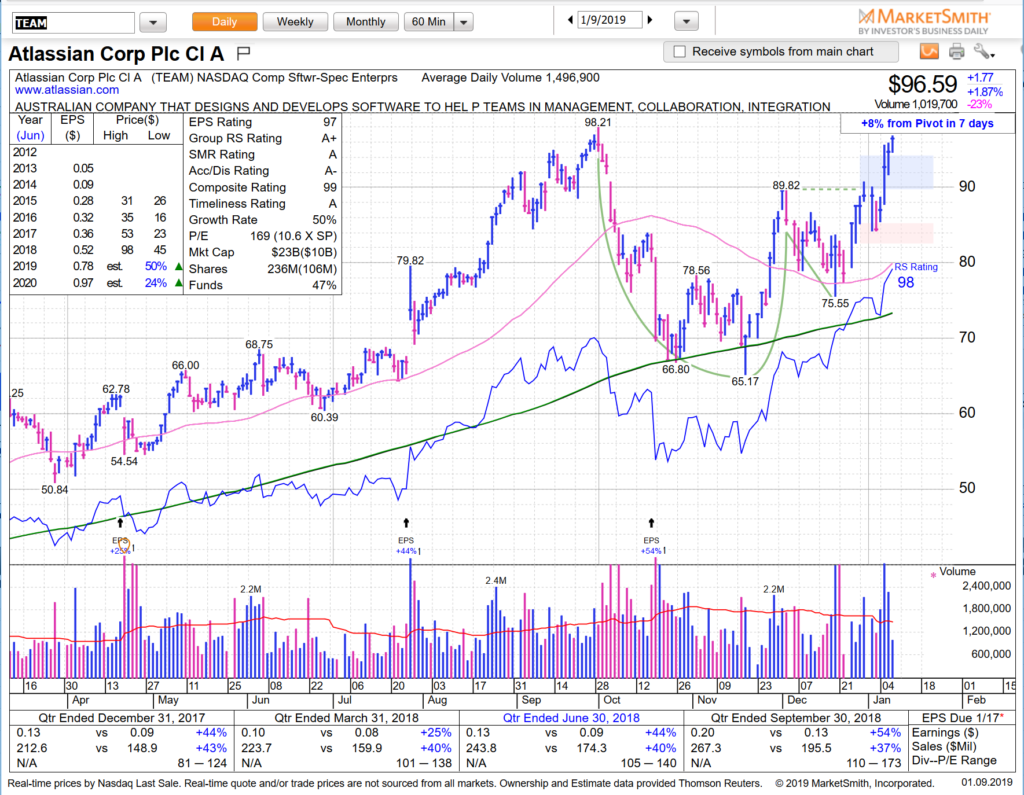
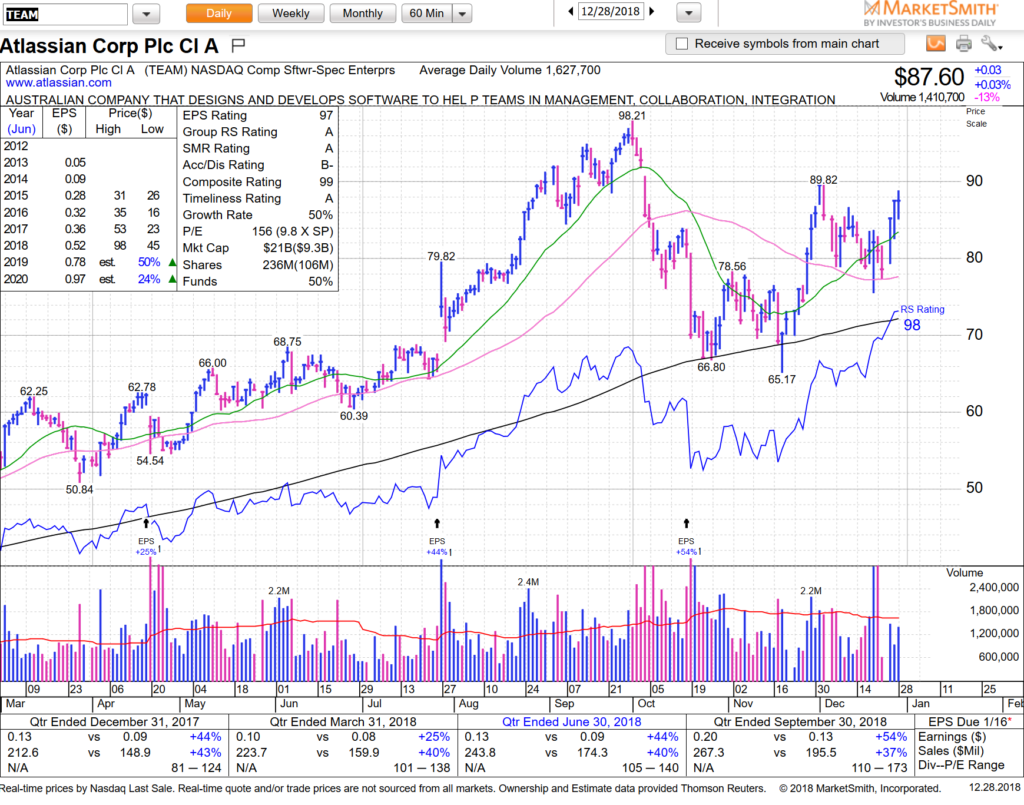
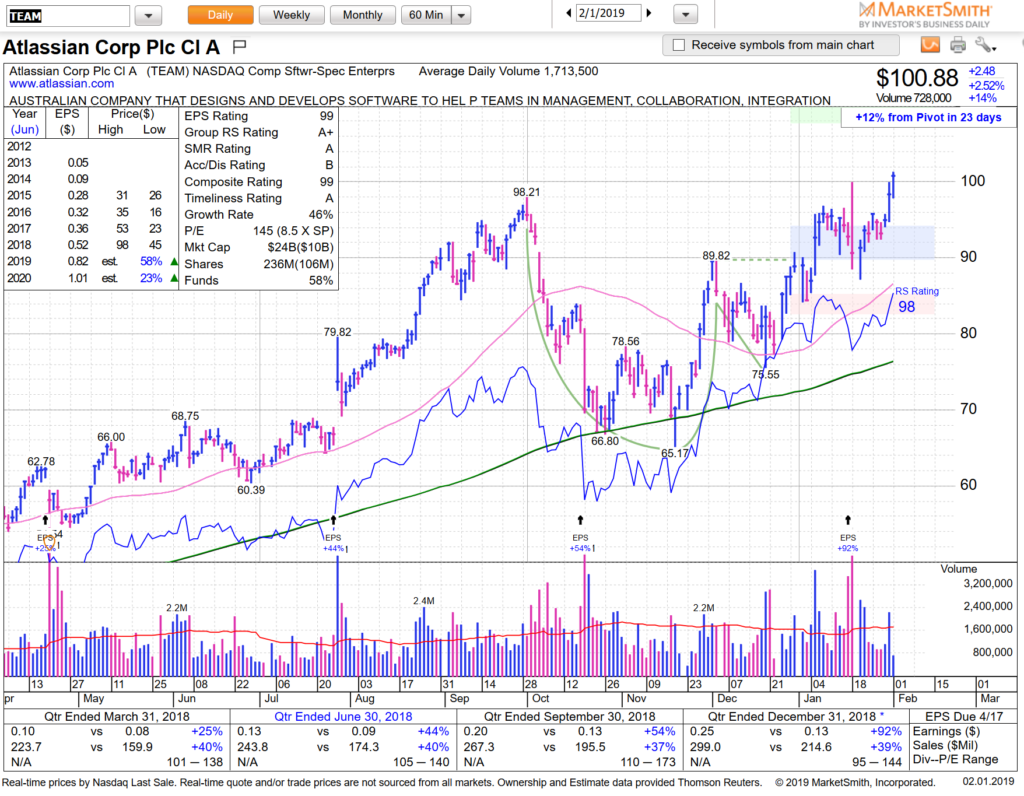
TEAM like this digestion near 100.

These hot stocks are not letting buyers in easily with few and shallow pullbacks. Keep them front and center of your watch-lists — from what we can tell, the run is not over yet. See you on streams. HCPG

IBD and Near Pivot magic

#IBDPartner

One of our favorite scans in MarketSmith is one we have discussed many times in this blog – Near Pivot. It’s a native scan to the product which populates stocks that are near pivot to some type of breakout, be it flat base, double bottom, cup with/without handle, etc. We’ve found many gems in that scan, as we have also in the IBD 50. There are a few that are currently in the IBD 50 AND Near Pivot: worth paying extra attention to these. Let’s review:

NOW earnings out Jan 30 and like this base near 192 a lot — keep an eye out for a move either before, or preferably after, earnings.

NOW also IBD #8 and Near Pivot candidate

PYPL is IBD #36 and also in MarketSmith Near Pivot scan. Earnings out Jan 30

TEAM is IBD #4 and earnings out today after the close. Keep on radar for tomorrow — chart looks set.

WDAY from the Near Pivot list we like this high base near 168. Earnings out Feb 25. Add to radar

SPY right into resistance but price trumps all — you know how we stand: bias long until 260 breaks. Note how buyers picked up that support today like algo magic.

Day 3 of our sweet spot between upper Dev 1 and 2. We haven’t hit the top of upper BB since glitch started in October. Best place for bulls is in the sweet spot.

Not a tape to be stubborn in — your opinions are worthless in the face of price. Rules to last in this business: follow your tells and obey your stops. And try as hard as you can not to overtrade. See you on the streams.

Q scan


#IBDPartner

Since the last time we posted the market has taken off from The Last stand 200sma weekly up over 10% on SPY and now close to major resistance. The picture says it all: 200sma touch holds perfectly and now has rallied all the way to 260 target that we talked about back in December. From 260-280 major congestion.

We have a few scenarios in mind:

Ideal one: pulls back somewhat near SPY 260 resistance to scare the bulls, invigorate the bears, and then rises back up to attack resistance without being overbought.

Bearish one: back to lows

Most frustrating one: goes thru resistance without creating any bases as the stretched elastic just keeps getting more stretched. Just like how support was meaningless on the way down (except for the final one which thankfully stood fast, the 200sma weekly) resistance has been also meaningless as market has climbed up 10%. However we are hitting 260 in overbought status so we do expect at least some chop and not a smooth uptrend like we have seen last 4 sessions.


If market does now do some horizontal work it would create a plethora of set-ups from our Go-To  favorite scan on MarketSmith we call our Q scan

All the charts below need to now form bases/handles but have great potential and are acting like leaders. CHGG we already posted on Sunday and is up 8% from that tweet. Now at highs if it can get a handle (pullback to 30-31) it would be one of the sweetest setups in the market.

We’ve talked about NOW numerous times in last few months — one of the best stocks in one of our favorite sectors, Enterprise Software, and to boot IBD #6. Ideally we would like a base right here in the low 190s before breaking out.

Our newsletter subscription runs thru PayPal and we know first hand how well the company is running right now — stock looks fantastic, and IBD #28. Same theme — we would like the stock to base out right here near 90 to set up. It’s already at upper BB and too stretched to buy right here.

TEAM another one we have talked about many times — also Software sector and IBD #4. We had a breakout alert at 84 on the stock a few weeks ago in our newsletter and it’s now setting up again near highs. Just like CHGG this one needs a handle.

VEEV is IBD #2 and has had a big V type move from 50sma weekly — we’d love a base here under 100. Similar theme in all these stocks: big runs, leaders, now need to chill and set-up.

Keep the above on your radars– if we can get this market to at least churn around here we should be able to get solid risk/reward entries that don’t require chasing. See you on the streams. HCPG

Now what?

We talked about the 200sma Weekly on the SPY as the last stand last weekend. Guess what? It held, perfectly. Now what? Well in every successful previous test in the last 14 years it held as a zone meaning that it was tested several times. However as we explained last week when successful, there were no continuation down candles on weekly meaning there was no follow through down on two consecutive candle on 200sma break. Maybe this time is different and we have a perfect algo-bottom on SPY 234? Or maybe not. We have 2/3 basket swing long SPY QQQ IWM and we will trail stop up and stay defensive.

As our readers know we are big fans of “tells”. In this business tells change constantly and quickly and you have to constantly look for new edges/hints; strategies based on patterns that give you a slight edge. Software stocks have acted as one of our tells now for the last few weeks — when market is weak but they are strong it gives us more confidence to go counter trend. And when they are weak but market is trying to rally we become more skeptical of the move and more apt to short the resistance than buy strength.

We’ll see how long they act as leaders but for now they are so keep them on your watch-list. If you are MarketSmith subscribers look through these three software groups: G3220 (up 22% YTD), G3582 (up also 22% YTD) and G3583 (up 19%).

Good example of this group acting like leaders is the pattern on TEAM — just incredible relative strength in current tape.

For those new traders who got hurt these last few months — learn from it. We got hit hard as rookies in the 2000-2002 bear market crash but did not get hurt in 2008-2009 and as stressful as this last rout has been, it has not hurt us either. Grab a binder, write down notes, print out charts, and constantly be reflexive. Getting hammered in your first bear market is acceptable. Next one is not.

See you on the streams. HCPG

The last stand

Below is the weekly 200sma, the last stand of any major SMA support.   As you can see it’s been key now for the last 14 yrs.  In the last bear market (financial crisis) we stayed below for 2 years 2008-2010.    Last time we tested the actual line was in 2011 when price stayed on it for weeks before finally climbing back over until hitting it again today, seven years later.   Do note that as much as we  would like a magical bounce on it this week from past observations when price has used it as support (2004, beginning of 2005, 2011) it’s been somewhat messy affair that lasted weeks with a few weeks dipping just under.

Here is a close up of the last time the 200sma weekly hit in 2011 where we spent 9 weeks basing on it.  Two things to note:  1) there were three weeks it closed under, 2) but there were no continuation candles down.   Price refused to budge down for continuation follow through below the 200sma and finally bulls won and took it higher.

The best case scenario is that what happened in 2011 also happens in 2018-2019 where we bounce/hold on this level and climb back up.  Worst case scenario of course is another recession and prolonged bear market that lasts for example 2019-2021.    We expect at least some attempt at holding this zone, give or take 3-4% similar to 2011,  especially since we are so stretched to the downside when we hit it today after 8 sessions under the 9/20EMA on 60min time-frame.      Whether that holds or not though after any initial bounce is another story.   One step at a time.   For now enjoy the day off tomorrow and focus on the holidays, friends and family. We’ll see you Wednesday on the streams. HCPG